Clustering
June 25, 2013
Clustering is a bit like classification in that data points need to be categorized, but whereas classification is a supervised learning task in which labels help to guide classification, clustering is an unsupervised learning task in which labels must be discovered.
When I was first introduced to code that could be used for clustering it was in Toby Segaran’s book Programming Collective Intelligence. Following his writing, I implemented hierarchical clustering, k-means clustering, and multidimensional scaling.
As I’ve learned more about clustering and where it is used I’ve realized that clustering is an essential tool to thinking well not just for AI, but also for humans. We cluster so often and so naturally as humans that we often don’t notice just how many categories we have created for ourselves. We cluster books by topic, and by genre. We cluster buildings by size. We cluster sentences according to the logical structure. We cluster the various domains of life. We even cluster situations about which we know nothing: we distinguish between known knowns, known unknowns, and unknown unknowns.
For related reasons, some cognitive biases people refer to as failings are actually deeply rational. The mistake people make in talking about this is that they confuse the problems they are solving with the problems the mind is solving. They solve the problem in a non-realtime context, but the mind is solving it in a realtime context. They are solving the problem in a manner that applies attention to the important details. The mind doesn't start with details. It starts with a sensory feed that must be converted and transformed into something meaningful. That sensory feed is so large that it can't even process all of it. It has to guess at what the important bits are if it is going to have a hope of keeping up.
Hierarchical Clustering
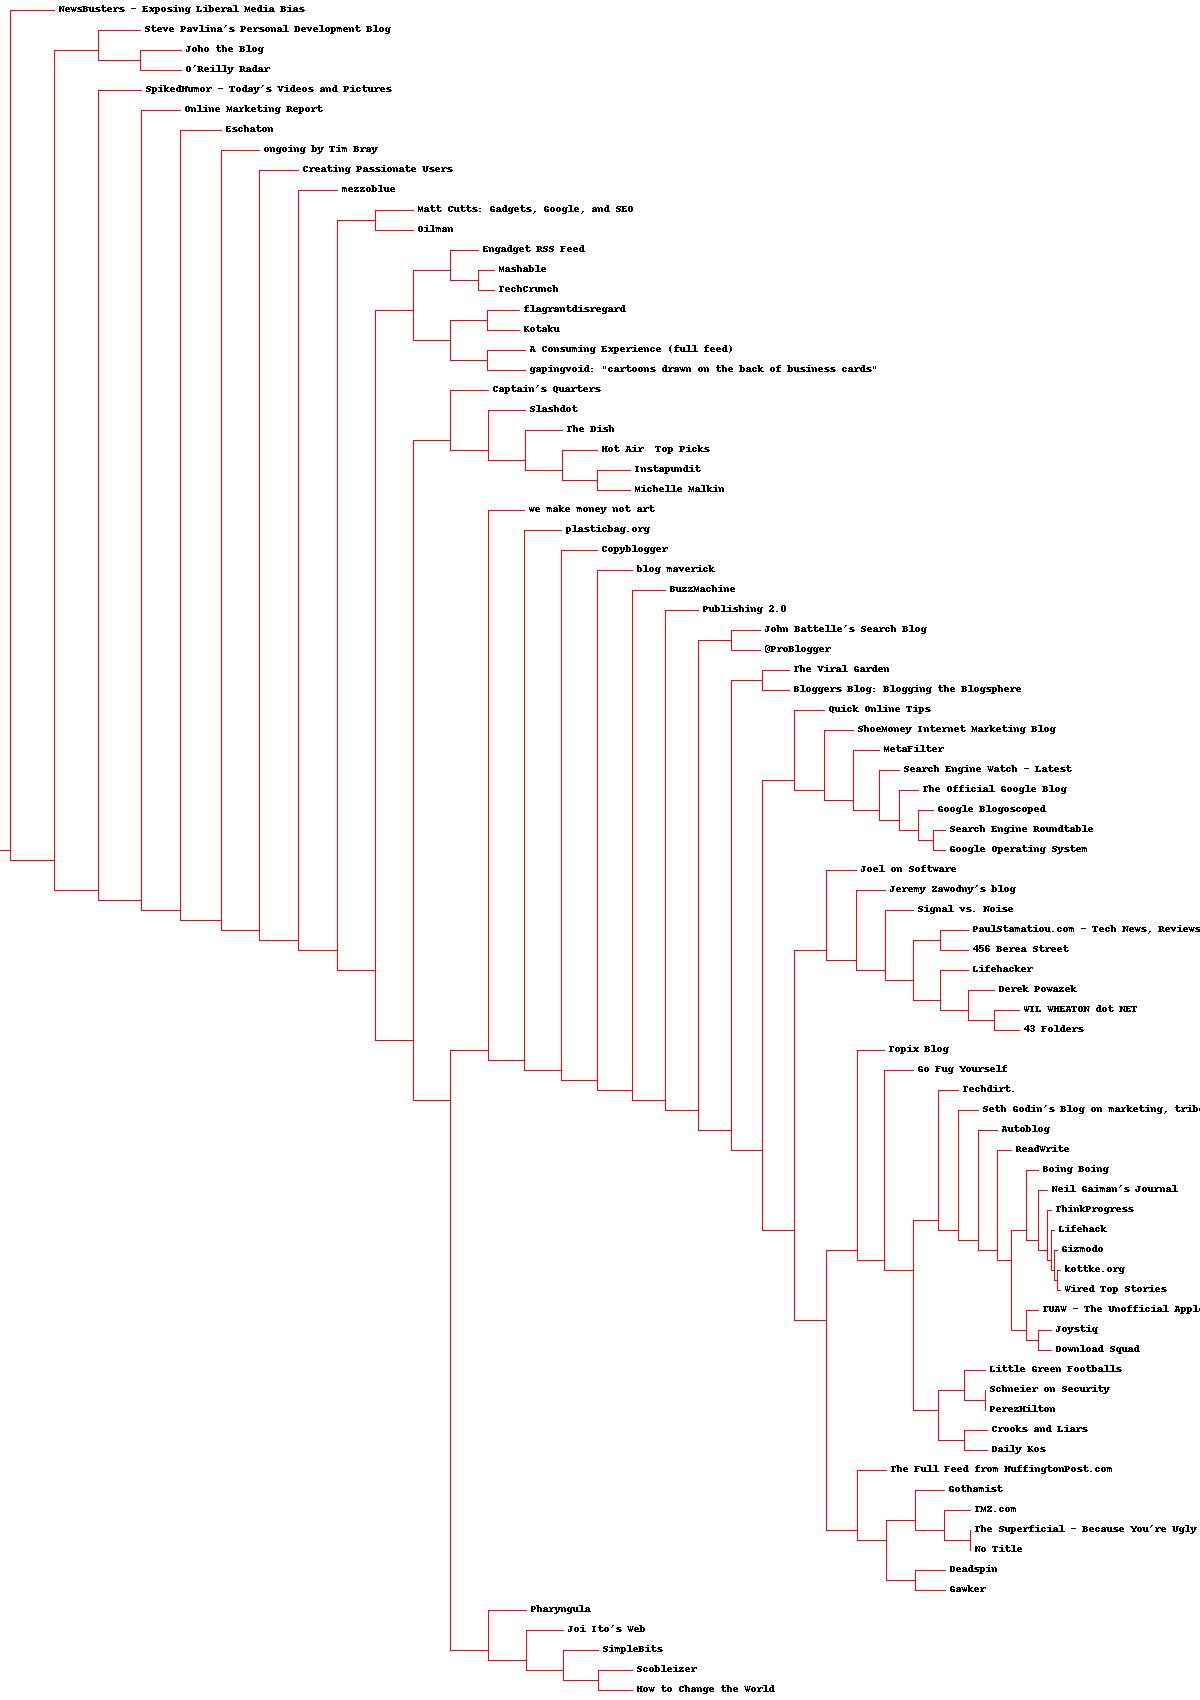
Hierarchical clustering starts out by saying that every element that you are looking at is its own distinct cluster. Then it tries to find the two clusters that are closest to each other. Once it finds those clusters it merges them. In some ways things are arbitrary. I can choose to look at any number of clusters I want. If I only want to look at three clusters I can stop running things when I get down to three clusters. However, I can also make a dendrogram if I make sure to incorporate the tree-like structure of the clustering process into my code.
While working through the last chapter I created a few dendrograms. The dendrogram presented below is the result of clustering 100 of the most popular blogs by the words used in their RSS feed. Of particular interest is that Google search related blogs tended to come out near each other.

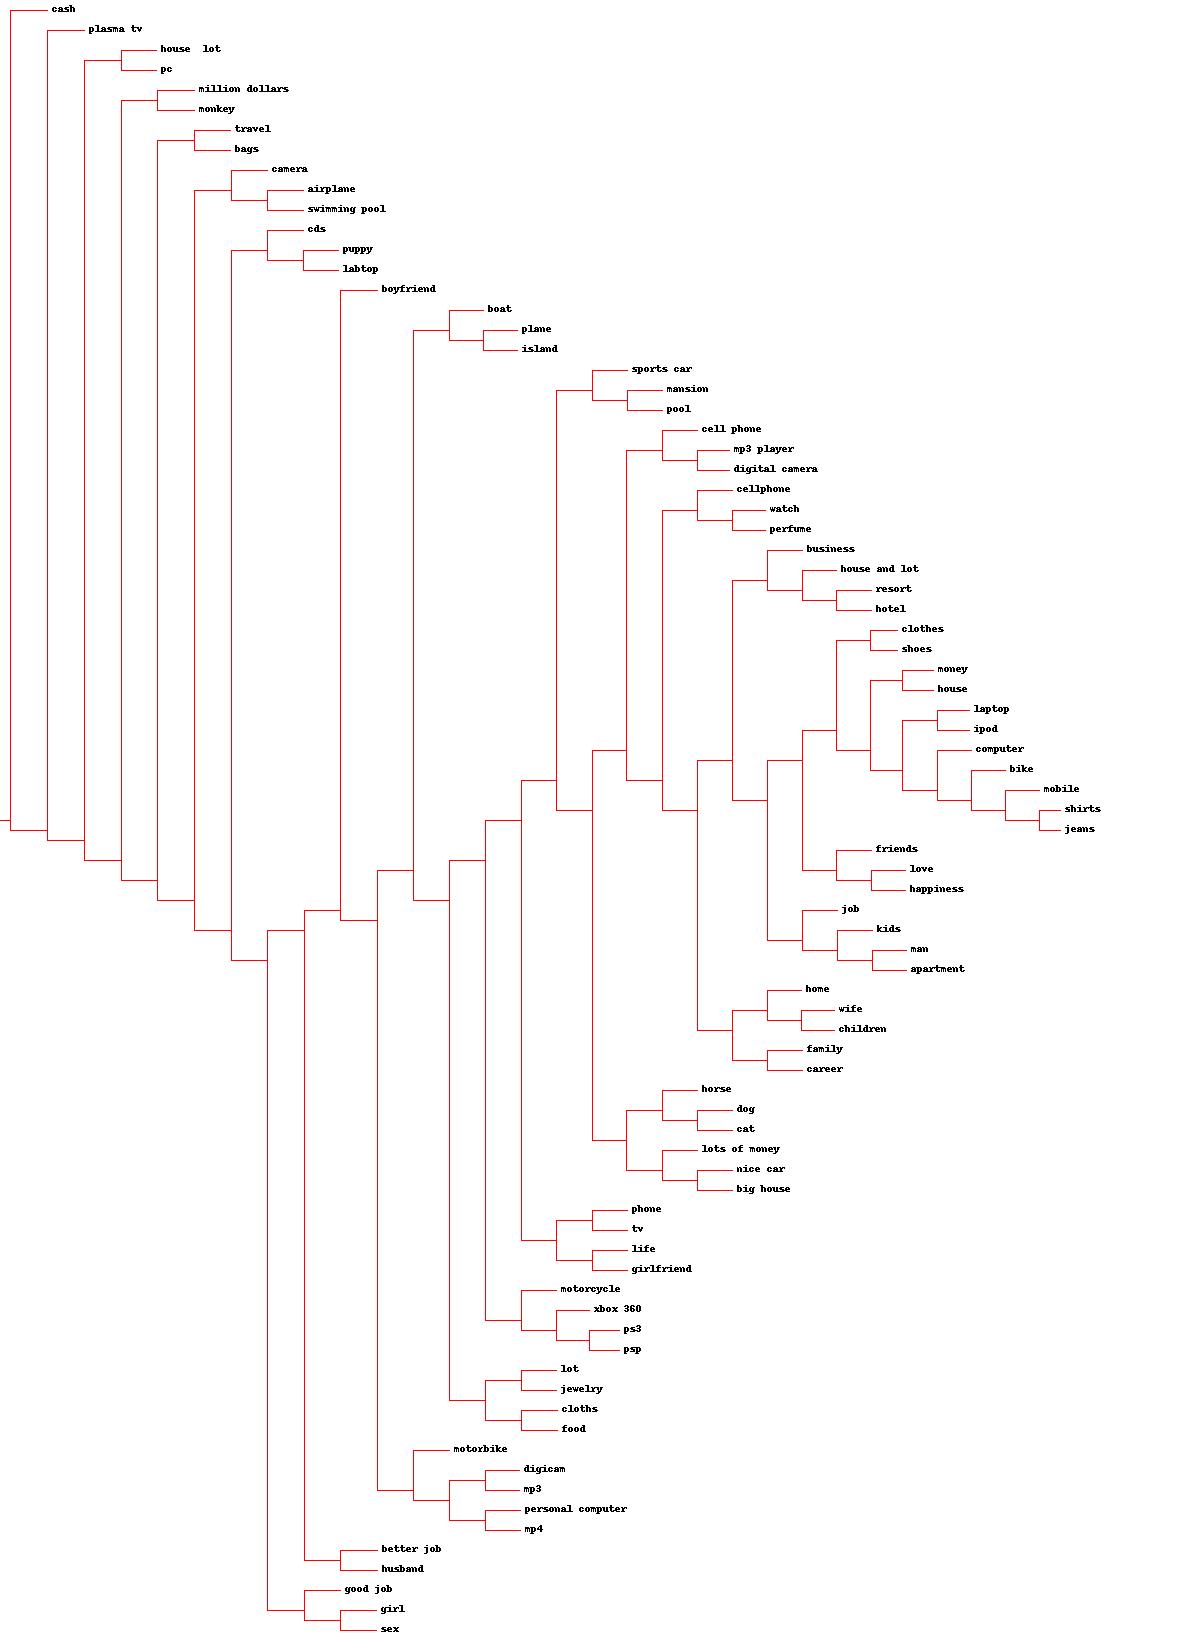
A far more interesting dendrogram that I produced shows what desires tend to be grouped together. A now dead site named zebo.com used to collect information about what people wanted. Using the data that they had made available I made a dendrogram of what things people tended to like. I found pursuing this graphic to be quite enjoyable.

k-means Clustering
Earlier I said that hierarchical clustering compared everything to everything else in order to figure out what two clusters were the closest to each other. As you can imagine this has terrible performance. O(n^2) to be more precise. Memoization can be used to make things a bit faster than that in practice, but the algorithm still doesn’t have the most wonderful scaling properties even with that. That is where K Means clustering comes in.
In k-means clustering you basically establish some dummy clusters called centroids. You create k of them. Then you find the closest centroid to a cluster. You lose the ability to make a dendrogram, things becomes even more arbitrary since the centroid selection is pretty random, and in exchange you gain an O(nk) search for the nearest element.
Multidimensional Scaling
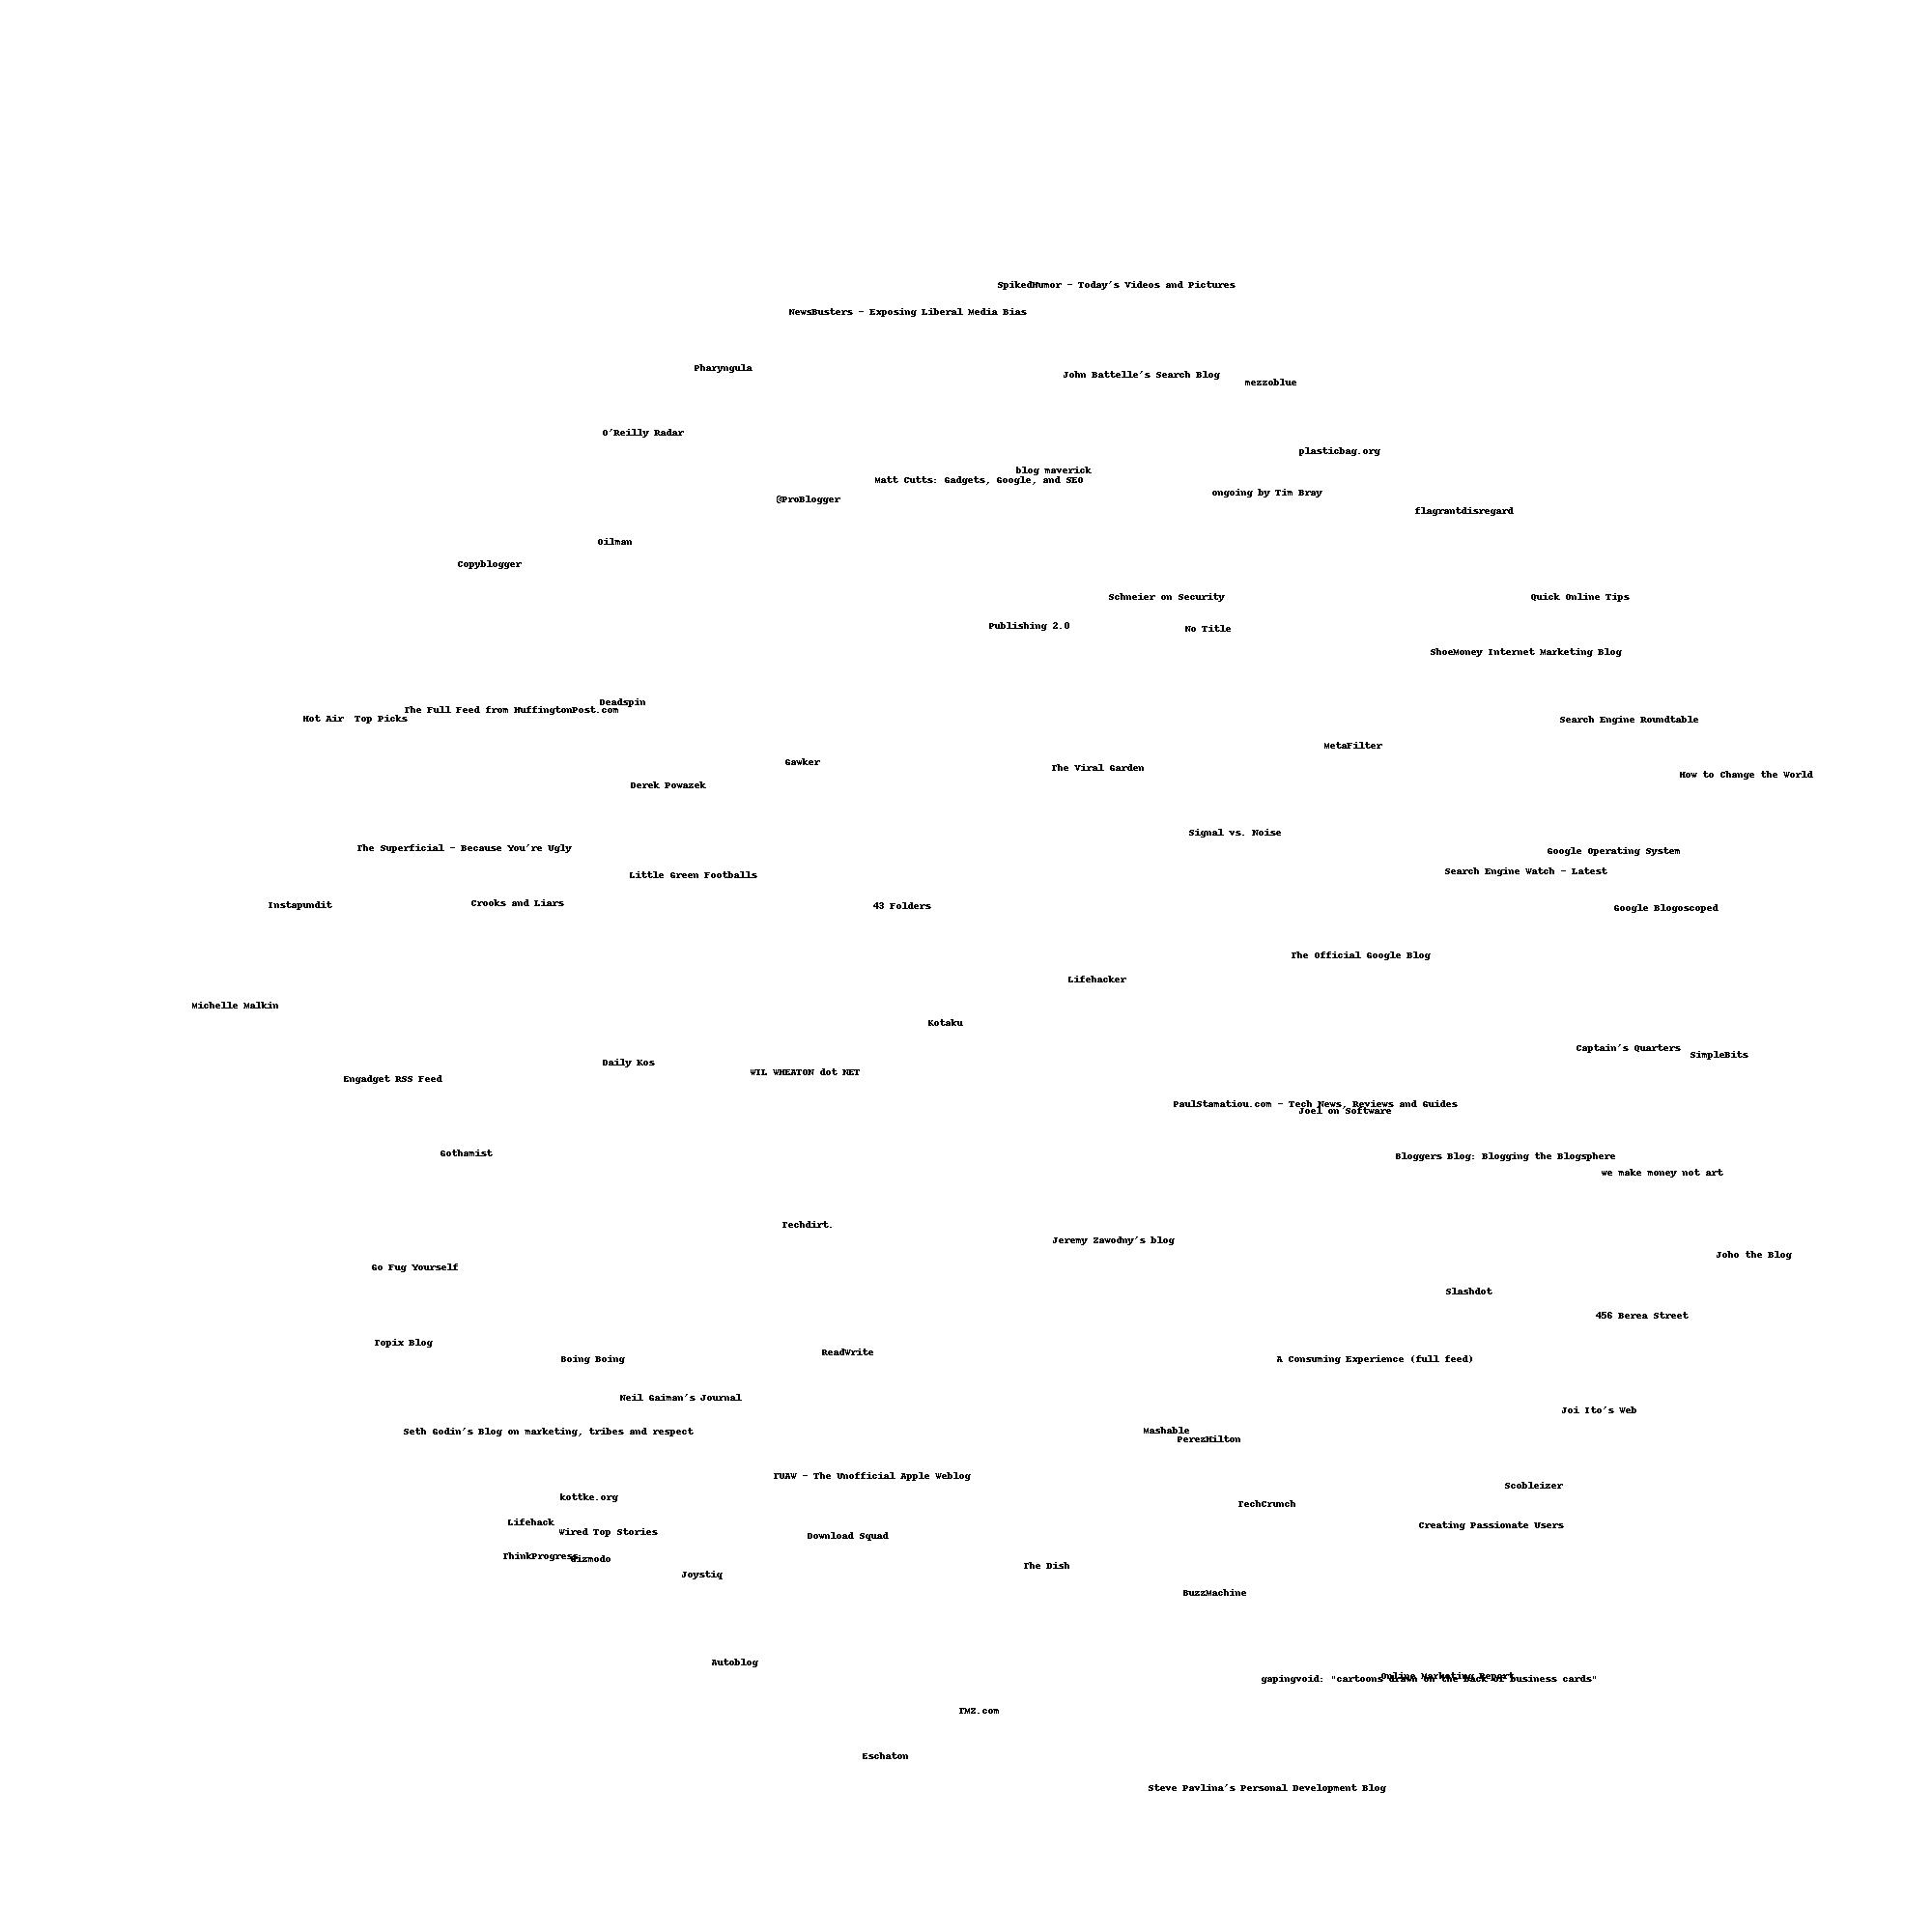
In multidimensional scaling you keep jiggering things by comparing them to a distance function on two variables and seeing how much that differs from a distance function on all the variables. This lets you reduce the number of variables while maintaining some sense of correlation. It also lets you plot things that have multiple dimensions in two-dimensional space.

Things I Built
- I visualized delicious data via a dendrogram that I computed.
- I implemented and used Euclidean and Manhattan distance algorithms for clustering.
- I experimented with different values of
kwhen using k-means clustering and saw how doing so changed the clustering error. - I implemented multidimensional scaling for both one dimension and three dimensions.